French cartographer Jacques Bertin established the first systematic rules for turning data into visual marks. His 1967 book Semiology of Graphics shifted mapmaking from an intuitive craft into a logical discipline by codifying how people perceive variables like size, color, and position. He also invented the physical reorderable matrix, which allowed users to manually sort datasets to find hidden patterns.
Part 1: The Nature of Graphics and Cartography
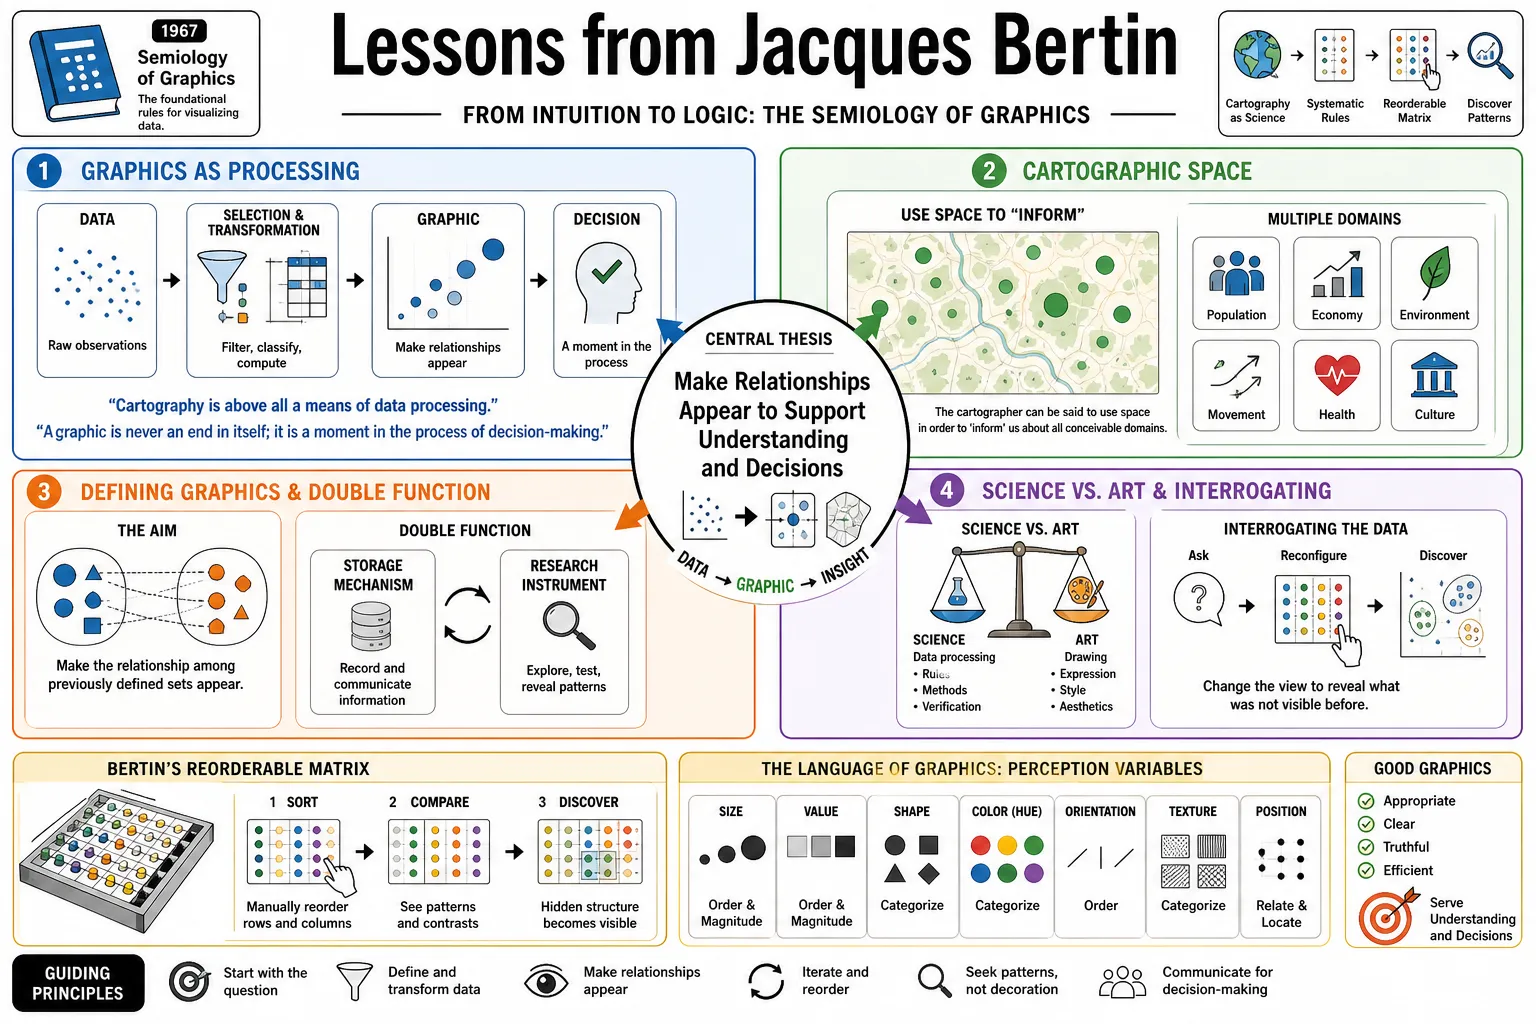
- On Graphics as Processing: "Cartography is above all a means of data processing." — Source: [Denis Wood]
- On the Role of the Graphic: "A graphic is never an end in itself; it is a moment in the process of decision-making." — Source: [Wikiquote]
- On the Double Function of Maps: "Graphics possess a double function as a storage mechanism and a research instrument." — Source: [ZHdK]
- On Cartographic Space: "The cartographer can be said to use space in order to 'inform' us about all conceivable domains." — Source: [ZHdK]
- On Defining Graphics: "The aim of the graphic is to make the relationship among previously defined sets appear." — Source: [Wikiquote]
- On Science vs. Art: "Cartography must be treated as a science of data processing rather than an art of drawing." — Source: [Mapping as Process]
- On Interrogating Documents: "A map, a diagram are documents to be interrogated." — Source: [Mapping as Process]
- On the Function of Design: "We should not ask the cartographer to be a designer. We ask him to be an operator." — Source: [Denis Wood]
- On Defining Information: "Information is the reply to a question." — Source: [Wikiquote]
- On Visual Interrogation: "Data is transformed into graphics to understand." — Source: [Mapping as Process]
Part 2: The Monosemic Language of Signs
- On Monosemic Representation: "Graphic representation is specifically monosemic, i.e., having just one meaning." — Source: [Wikiquote]
- On Polysemy in Art: "Unlike art or language, which can be ambiguous or polysemic, a functional graphic must leave no room for multiple interpretations." — Source: [Axis Maps]
- On the Simplicity of Graphics: "Graphics is a very simple and efficacious sign system which anyone can put to use." — Source: [Wikiquote]
- On Constructing Signs: "A graphic is not 'drawn'; it is a system of signs that is 'constructed' to convey precise data." — Source: [Denis Wood]
- On the Limit of Vocabulary: "The vocabulary of graphics is strictly dictated by the nature of the data it represents." — Source: [Mapping as Process]
- On Intuition vs. Logic: "The design of a graphic should move away from aesthetic intuition toward a logical system." — Source: [Medium]
- On the Painter's Eye: "The 'Painter's Eye' in graphics is not about decoration, but about perceiving the strict rules of visual encoding." — Source: [Wikiquote]
- On the Meaning of a Mark: "Every visual mark must strictly correlate to a defined component of the underlying data." — Source: [Jonathan Soma]
- On Reading vs. Seeing: "Accordingly, a graphic which must be READ... does not solve the problem. We must design it to be SEEN." — Source: [Denis Wood]
- On Universal Comprehension: "The rules of semiology ensure that a correctly constructed graphic is universally legible across different contexts." — Source: [ZHdK]
Part 3: The Power of the Reorderable Matrix
- On the Fundamental Construction: "The reorderable matrix is the fundamental construction of graphic information processing." — Source: [Data Physicalization]
- On the Discovery of Patterns: "Permuting rows and columns allows the user to visually group similar patterns, a process essential for seriation." — Source: [Data Physicalization]
- On the 'Domino' System: "The Dominos were physical, reorderable matrices allowing researchers to manually manipulate data until clarity emerged." — Source: [Data Physicalization]
- On Iterative Construction: "A graphic is constructed and reconstructed until it reveals all the relationships constituted by the interplay of the data." — Source: [Wikiquote]
- On the User as Operator: "The best graphic operations are those carried out by the decision-maker himself through physical manipulation." — Source: [Data Physicalization]
- On Transcription: "The first step of the matrix method is transcription: converting a data table directly into uniform visual cells." — Source: [Data Physicalization]
- On Permutation: "By shifting the order of variables, the matrix transforms chaotic tabular data into visible, clustered knowledge." — Source: [Mapping as Process]
- On Simplification: "The goal of matrix permutation is to achieve reduction: finding the core message revealed by visual clusters." — Source: [Data Physicalization]
- On Photographic Communication: "Once the optimal permutation is found in the physical dominoes, it is photographed to serve as the final communicative figure." — Source: [Data Physicalization]
- On Information Processing: "The matrix proves that manipulating data visually is a more profound analytical act than merely drawing its initial state." — Source: [Mapping as Process]
Part 4: The Visual Variables: Position and Size
- On the Power of Position: "The x and y coordinates are the most powerful visual variables because they alone are continuous and represent two components simultaneously." — Source: [Jonathan Soma]
- On the Exclusivity of Position: "Position on the plane is the only variable that inherently determines the basic spatial framework of any graphic." — Source: [Medium]
- On Size as Quantity: "Size is the only variable, aside from position, that is truly quantitative and capable of showing 'how much'." — Source: [Axis Maps]
- On the Ordering of Size: "A larger shape is universally perceived as representing a greater quantity than a smaller one." — Source: [Medium]
- On Shape's Limitations: "Shape is the least effective variable for showing order or quantity, as a square is not inherently 'more' than a circle." — Source: [Jonathan Soma]
- On Shape for Association: "While weak for quantities, shape remains highly associative, allowing us to identify and group specific qualitative objects." — Source: [Axis Maps]
- On Visual Selectivity: "Position and size are highly selective, meaning the eye can instantly isolate all items sharing these properties." — Source: [Medium]
- On Encoding Ratios: "Because size is quantitative, the viewer can estimate numerical ratios directly from the visual weight of the marks." — Source: [Jonathan Soma]
- On the Hierarchy of Variables: "A cartographer must prioritize position and size for the most critical quantitative data before applying other variables." — Source: [Axis Maps]
Part 5: The Visual Variables: Value, Texture, and Color
- On the Role of Value: "Value—the lightness or darkness of a mark—is strictly ordered and ideal for showing progressions." — Source: [Jonathan Soma]
- On the Limits of Value: "While value shows order effectively, it is not quantitative; it is difficult to perceive one shade of grey as exactly twice as dark as another." — Source: [Medium]
- On Color as Categories: "Color, or hue, is associative rather than ordered; red is not 'greater' than blue, making it perfect for categorical data." — Source: [Axis Maps]
- On the Misuse of Color: "Using a rainbow color scale to represent ordered or quantitative data violates the perceptual rules of the visual variables." — Source: [Medium]
- On Texture's Function: "Texture, or the variation in grain and pattern, can provide order and association without altering the underlying hue or value." — Source: [Jonathan Soma]
- On Orientation: "The orientation or angle of a mark is selective, allowing the eye to pick out parallel alignments across a chaotic field." — Source: [Axis Maps]
- On Combining Variables: "The most effective maps carefully layer value for density and color for categories, preventing perceptual conflicts." — Source: [Medium]
- On Retinal Perception: "These retinal variables are not arbitrary design choices; they are dictated by the hardwired limits of human visual processing." — Source: [ZHdK]
- On Maintaining Legibility: "Applying too many retinal variables to a single mark destroys selectivity and turns a map into visual noise." — Source: [Jonathan Soma]
Part 6: Efficiency and the Questioning of Data
- On Defining Efficiency: "Efficiency answers any question at every level, which enables the reader to perceive patterns and create knowledge." — Source: [Wikiquote]
- On Time and Memory: "We utilize graphics to save time and consequently memory; in order to SEE, that is to perceive immediately." — Source: [Denis Wood]
- On Measuring Success: "If one construction requires a shorter observation time than another to answer a given question, it is more efficient." — Source: [Wikiquote]
- On the Elementary Level: "An efficient graphic must instantly answer the elementary question: What is the specific value of X at point Y?" — Source: [Mapping as Process]
- On the Intermediate Level: "Beyond individual points, the graphic must allow the eye to discern trends within specific subsets of the data." — Source: [Mapping as Process]
- On the Overall Level: "The highest function of the graphic is to reveal the overarching, general relationship across the entire dataset." — Source: [Mapping as Process]
- On the Invariant Subject: "Every graphic revolves around an Invariant—the central topic—against which the changing Components are plotted." — Source: [Medium]
- On Minimizing Cognitive Load: "The primary objective of a map's design is to eliminate the need for the reader to consciously calculate or deduce." — Source: [Denis Wood]
- On the Output of Graphics: "Knowledge is the direct output we crave, and it is achieved only when the graphic efficiently answers the questions posed to it." — Source: [Wikiquote]
Part 7: Mobile Images vs. Dead Images
- On the Fixity of the Image: "The great difference between the graphic representation of yesterday and tomorrow is the disappearance of the congenital fixity of the image." — Source: [Wikiquote]
- On 'Dead' Illustrations: "A static graphic that cannot be manipulated or reorganized remains a dead image, serving only as an illustration." — Source: [Data Physicalization]
- On the 'Living' Image: "When one can superimpose, juxtapose, transpose, and permute graphic images, the image passes into a living research instrument." — Source: [Wikiquote]
- On Interactivity: "The future of cartography lies not in better printing, but in the ability to physically or digitally interact with the data structure." — Source: [Data Physicalization]
- On Transposing Data: "Transposing and superimposing graphic layers allows the analyst to test hypotheses in real-time." — Source: [Mapping as Process]
- On Shifting Perspectives: "A mobile image refuses to present a single authorized view, instead offering an environment for constant visual inquiry." — Source: [Axis Maps]
- On the End of the Final Draft: "Because the image is mobile, there is no true final draft—only the current state of investigation." — Source: [Denis Wood]
- On Accessibility of Research: "By making the image mobile, graphics transition from the domain of elite designers to widely accessible tools for researchers." — Source: [Data Physicalization]
- On Breaking Congenital Fixity: "To break the fixity of the image is to free the data from the assumptions of the person who originally collected it." — Source: [Wikiquote]
Part 8: Decision-Making and the Discovery of Simplifications
- On the Graphic as a Starting Point: "The graphic is no longer only the representation of a final simplification, it is a point of departure for discovery." — Source: [Wikiquote]
- On Justifying Simplifications: "Visual manipulation provides the definitive means for justifying the simplifications we make about complex datasets." — Source: [Mapping as Process]
- On the Moment of Decision: "A graphic is a momentary crystallization of data designed specifically to provoke and inform a decision." — Source: [Wikiquote]
- On Recognizing Patterns: "Decision-making in cartography relies entirely on the eye's ability to recognize structured patterns out of visual noise." — Source: [Denis Wood]
- On the Analyst's Responsibility: "The responsibility of the analyst is to manipulate the variables until the most honest simplification emerges." — Source: [Data Physicalization]
- On the Purpose of Simplification: "We do not simplify to reduce detail, but to expose the underlying architecture of the information." — Source: [Medium]
- On Visual Proof: "A properly constructed graphic serves as a visual proof of the relationships discovered within the data." — Source: [Jonathan Soma]
- On Actionable Knowledge: "When graphics are processed rather than merely drawn, they bridge the gap between raw statistics and actionable knowledge." — Source: [Mapping as Process]
- On the Ultimate Value of Semiology: "The semiology of graphics ultimately ensures that the decisions we derive from our data are grounded in visual truth, not artistic accident." — Source: [ZHdK]