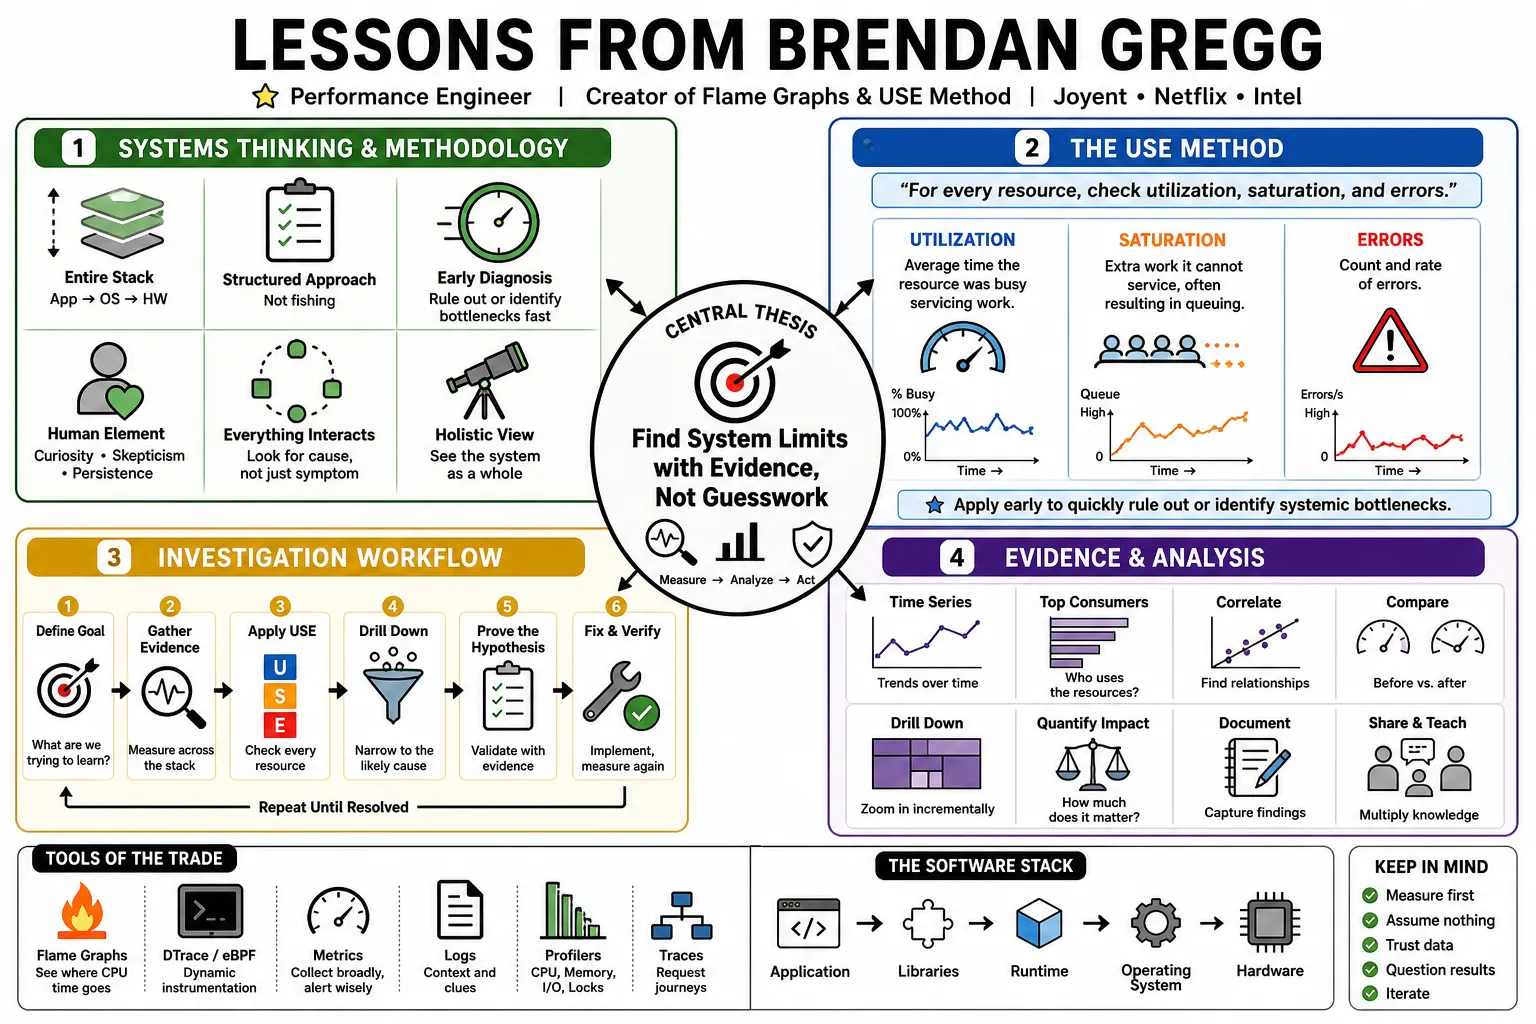
Lessons from Brendan Gregg
Brendan Gregg is a computing performance engineer known for Flame Graphs, the USE Method and his books Systems Performance and BPF Performance Tools. He has worked on performance at Joyent, Netflix and Intel and, per his blog, joined OpenAI in 2026. — Brendan Gregg: Flame Graphs.
Part 1: Systems Thinking and Methodology
- On the USE Method: Gregg summarizes the USE Method: "For every resource, check utilization, saturation, and errors." — Brendan Gregg: The USE Method.
- On Utilization: Gregg defines utilization as "the average time that the resource was busy servicing work." — Brendan Gregg: The USE Method.
- On Saturation: Gregg defines saturation as "the degree to which the resource has extra work which it can't service, often queued," expressed as a queue length, e.g. "the CPUs have an average run queue length of four." — Brendan Gregg: The USE Method.
- On Errors: Gregg: "Errors should be investigated because they can degrade performance, and may not be immediately noticed when the failure mode is recoverable." — Brendan Gregg: The USE Method.
- On Using It Early: The USE Method is "intended to be used early in a performance investigation, to identify systemic bottlenecks." — Brendan Gregg: The USE Method.
- On Building a Checklist: The USE Method "directs the construction of a checklist, which for server analysis can be used for quickly identifying resource bottlenecks or errors," and begins by posing questions rather than seeking answers. — Brendan Gregg: The USE Method.
- On Errors: Brendan Gregg: "Errors should be investigated because they can degrade performance, and may not be immediately noticed when the failure mode is recoverable." — www.brendangregg.com/usemethod.html.
- On the Performance Mantras: Gregg's performance mantras: "Don't do it. Do it, but don't do it again. Do it less. Do it later. Do it when they're not looking. Do it concurrently. Do it cheaper." — Brendan Gregg: Performance Methodology.
- On the Problem Statement Method: Gregg's problem statement questions include "What makes you think there is a performance problem?", "Has this system ever performed well?" and "What has changed recently? (Software? Hardware? Load?)" — Brendan Gregg: Performance Methodology.
- On Workload Characterization: Gregg's workload characterization asks "Who is causing the load?", "Why is the load called?", "What is the load?" and "How is the load changing over time?" — Brendan Gregg: Performance Methodology.
Part 2: The Illusion of Metrics and CPU
- On Misleading CPU Utilization: Gregg: "The metric we all use for CPU utilization is deeply misleading, and getting worse every year." — Brendan Gregg: "CPU Utilization is Wrong" (2017).
- On Being Stalled: Gregg: "Chances are, you're mostly stalled, but don't know it." Stalled means the processor was not making forward progress, usually waiting on memory I/O. — Brendan Gregg: "CPU Utilization is Wrong" (2017).
- On Non-Idle Time: Gregg: "The metric we call CPU utilization is really 'non-idle time': the time the CPU was not running the idle thread." — Brendan Gregg: "CPU Utilization is Wrong" (2017).
- On DRAM as the Bottleneck: Gregg: "When you see high %CPU in top(1), you might think of the processor as being the bottleneck… when it's really those banks of DRAM." — Brendan Gregg: "CPU Utilization is Wrong" (2017).
- On Instructions per Cycle: Gregg: "The key metric here is instructions per cycle (insns per cycle: IPC), which shows on average how many instructions we were completed for each CPU clock cycle." — Brendan Gregg: "CPU Utilization is Wrong" (2017).
- On an IPC of 0.78: Gregg: "So an IPC of 0.78 on a 4-wide system, means the CPUs are running at 19.5% their top speed." — Brendan Gregg: "CPU Utilization is Wrong" (2017).
- On Directing Tuning Effort: Gregg: "Understanding how much your CPUs are stalled can direct performance tuning efforts between reducing code or reducing memory I/O." — Brendan Gregg: "CPU Utilization is Wrong" (2017).
- On Scaling With Cores: Gregg notes that since about 2005 "processors have scaled using more cores and hyperthreads, plus multi-socket configurations, all putting more demand on the memory subsystem." — Brendan Gregg: "CPU Utilization is Wrong" (2017).
- On Performance Monitoring Counters: Gregg says to see what CPUs are really doing use "Performance Monitoring Counters (PMCs): hardware counters that can be read using Linux perf, and other tools." — Brendan Gregg: "CPU Utilization is Wrong" (2017).
Part 3: eBPF and Kernel Tracing
- On Linux Superpowers: Brendan Gregg: "It's as if Linux is gaining superpowers, one at a time." — www.brendangregg.com/blog/2015-05-15/ebpf-one-small-step.html.
- On Teaching the USE Method: Brendan Gregg: "I developed the USE Method to teach others how to solve common performance issues quickly, without overlooking important areas." — www.brendangregg.com/usemethod.html.
- On Methodology: Brendan Gregg: "Analysis without a methodology can become a fishing expedition, where metrics are examined ad hoc, until the issue is found – if it is at all." — www.brendangregg.com/methodology.html.
- On Dynamic Tracing: Brendan Gregg: "dynamic instrumentation (aka dynamic tracing) is the superpower that lets you trace any software function in a running binary without restarting it." — www.brendangregg.com/blog/2019-08-19/bpftrace.html.
- On Tracing in 2014: Brendan Gregg: "You couldn't frequency count process names, function names, stack traces, or other arbitrary data in the kernel." — www.brendangregg.com/blog/2016-10-27/dtrace-for-linux-2016.html.
- On Wrong or Misleading Benchmarks: Brendan Gregg: "It's been my job to get to the bottom of many of these, and I typically find that they are wrong or misleading almost every time." — www.brendangregg.com/activebenchmarking.html.
- On 80 Percent of Issues: Brendan Gregg: "I find it solves about 80% of server issues with 5% of the effort" — www.brendangregg.com/usemethod.html.
- On Effort Up Front: Brendan Gregg: "It requires more effort at the start, but can save much more time and money later on." — www.brendangregg.com/activebenchmarking.html.
- On Short-Lived Processes: Brendan Gregg: "Short-lived processes can cause performance problems, and aren't visible from interval-sampling tools like top(1)." — www.brendangregg.com/blog/2014-07-28/execsnoop-for-linux.html.
Part 4: Flame Graphs and Visualization
- On Reading a Flame Graph: Gregg: "The x-axis shows the stack profile population, sorted alphabetically (it is not the passage of time), and the y-axis shows stack depth, counting from zero at the bottom." — Brendan Gregg: Flame Graphs.
- On Width: Gregg: "Each rectangle represents a stack frame. The wider a frame is is, the more often it was present in the stacks." — Brendan Gregg: Flame Graphs.
- On the Top Edge: Gregg: "The top edge shows what is on-CPU, and beneath it is its ancestry." — Brendan Gregg: Flame Graphs.
- On Static and Dynamic Views: Gregg: "As a static visualization, a flame graph can be saved as an image, included in print (books), and will still convey the 'big picture' as only the most frequent frames have enough width for labels." — Brendan Gregg: Flame Graphs.
- On Off-CPU Flame Graphs: Brendan Gregg: "Off-CPU analysis, which can be visualized as Off-CPU time flame graphs, can begin to solve the rest." — www.brendangregg.com/blog/2016-01-20/ebpf-offcpu-flame-graph.html.
- On CPU Flame Graphs: Brendan Gregg: "CPU profiles, which can be visualized as a CPU flame graph, can solve a wide range of CPU usage issues." — www.brendangregg.com/blog/2016-01-20/ebpf-offcpu-flame-graph.html.
- On Seeing the Full Picture: Brendan Gregg: "Seeing both on-CPU and off-CPU flame graphs shows you the full picture" — www.brendangregg.com/blog/2016-01-20/ebpf-offcpu-flame-graph.html.
- On Casual Benchmarking: Brendan Gregg: "casual benchmarking: you benchmark A, but actually measure B, and conclude you've measured C." — www.brendangregg.com/activebenchmarking.html.
- On Accurate Results: Brendan Gregg: "Accurate results enable good choices to be made: picking options that deliver the best price performance, and are most likely to scale under load." — www.brendangregg.com/activebenchmarking.html.
- On Emergency Checklists: Brendan Gregg: "Like an emergency checklist in a flight manual, it is intended to be simple, straightforward, complete, and fast." — www.brendangregg.com/usemethod.html.
Part 5: Performance Engineering Strategy
- On Halving Infrastructure Spend: Brendan Gregg: "A new performance team can likely find enough optimizations to halve infrastructure spend in their first couple of years, even for companies that have been using commercial performance or observability tools." — www.brendangregg.com/blog/2025-08-04/when-to-hire-a-computer-performance-enginee.
- On a One-Hour Meeting: Brendan Gregg: "Having a one hour meeting with a performance engineering team can save months of engineering effort" — www.brendangregg.com/blog/2025-08-04/when-to-hire-a-computer-performance-enginee.
- On Incorrect Assumptions: Brendan Gregg: "But this can lead to developers proposing ideas based on incorrect assumptions. (This actually happens a lot.)" — www.brendangregg.com/blog/2025-08-04/when-to-hire-a-computer-performance-enginee.
- On Knowing When to Move On: Brendan Gregg: "Performance engineers can spend six months working a single issue without success, when it would be better to try for a week and then turn their attention elsewhere." — www.brendangregg.com/methodology.html.
- On More Than Tools: Brendan Gregg: "Performance engineers do much more than those tools, working with development teams and vendors to build, test, debug, tune, and adopt new performance solutions, and to find deep optimizations that those tools can miss." — www.brendangregg.com/blog/2025-08-04/when-to-hire-a-computer-performance-enginee.
- On Self-Service GUIs: Brendan Gregg: "I expect they'll use both without knowing it via the self-service GUIs we are building (Vector)" — www.brendangregg.com/blog/2019-08-19/bpftrace.html.
- On Spending Too Long: Brendan Gregg: "At any complex environment, spending too much time analyzing one performance problem takes time away from other problems and other possible wins." — www.brendangregg.com/methodology.html.
- On Impressive Bar Charts: Brendan Gregg: "I've seen countless slide decks, blog posts, and articles that present an impressive bar chart of comparitive results, but then no supporting technical evidence." — www.brendangregg.com/activebenchmarking.html.
Part 6: Benchmarking Reality
- On Active Benchmarking: Gregg: "Active benchmarking helps you accurately test the true target of the benchmark, and properly understand its results. It requires more effort at the start, but can save much more time and money later on." — Brendan Gregg: Active Benchmarking.
- On Passive Benchmarking: Gregg on passive benchmarking: "Data is not Information. A telltale sign is when the only technical results presented are the benchmark results." — Brendan Gregg: Active Benchmarking.
- On Fire and Forget: Gregg: benchmark slide decks are typically "wrong or misleading almost every time," because "they have been run passively, 'fire and forget' style, with no additional analysis." — Brendan Gregg: Active Benchmarking.
- On Analyzing While It Runs: Gregg: "With active benchmarking, you analyze performance while the benchmark is still running (not just after it's done), using other tools." — Brendan Gregg: Active Benchmarking.
- On Why X and Not 2X: Gregg's test for whether someone did active benchmarking: "Can they explain why the benchmark result was X, and not 2X (twice as fast)? ie, what is the limiting factor?" — Brendan Gregg: Active Benchmarking.
- On the Benchmarking Checklist: Gregg's benchmarking checklist: "Why not double? Did it break limits? Did it error? Does it reproduce? Does it matter? Did it even happen?" — Brendan Gregg: Performance Methodology.
- On Confirming What Is Tested: Brendan Gregg: "You can confirm that the benchmark tests what you intend it to, and that you understand what that is." — www.brendangregg.com/activebenchmarking.html.
- On Finding the True Limiter: Brendan Gregg: "While the benchmark is running, analyze the performance of all components involved using other tools, to identify the true limiter of the benchmark." — www.brendangregg.com/activebenchmarking.html.
- On Explaining X Versus 2X: Brendan Gregg: "Can they explain why the benchmark result was X, and not 2X (twice as fast)?" — www.brendangregg.com/activebenchmarking.html.
Part 7: Anti-Patterns and Common Pitfalls
- On the Streetlight Anti-Method: Gregg's Streetlight Anti-Method: "Pick observability tools that are: familiar, found on the Internet, found at random. Run tools. Look for obvious issues." — Brendan Gregg: Performance Methodology.
- On the Drunk Man Anti-Method: Gregg's Drunk Man Anti-Method is: "Change things at random until the problem goes away." — Brendan Gregg: Performance Methodology.
- On the Blame-Someone-Else Anti-Method: Gregg's Blame-Someone-Else Anti-Method: "Find a system or environment component you are not responsible for. Hypothesize that the issue is with that component. Redirect the issue to the responsible team." — Brendan Gregg: Performance Methodology.
- On the Passive Benchmarking Anti-Method: Gregg's Passive Benchmarking Anti-Method: "Pick a benchmark tool. Run it with a variety of options. Make a slide deck of the results. Hand the slides to management." — Brendan Gregg: Performance Methodology.
- On the Traffic Light Anti-Method: Gregg's Traffic Light Anti-Method: "Open dashboard. All green? Assume everything is good. Something red? Assume that's a problem." — Brendan Gregg: Performance Methodology.
- On the Random Change Anti-Method: Gregg's Random Change Anti-Method: "Pick a random attribute to change (eg, a tunable)," change it one way, measure, change it the other way, measure, and keep whichever is better. — Brendan Gregg: Performance Methodology.
- On Different Methodologies: Brendan Gregg: "Different methodologies are suited for solving different classes of issues, and you may try more than one before accomplishing your goal." — www.brendangregg.com/methodology.html.
- On Averaging Away Saturation: Brendan Gregg: "A burst of high utilization can cause saturation and performance issues, even though utilization is low when averaged over a long interval." — www.brendangregg.com/usemethod.html.
- On the Traffic Light Anti-Method: Brendan Gregg: "All green? Assume everything is good. Something red? Assume that's a problem." — www.brendangregg.com/methodology.html.
- On Starting With Questions: Brendan Gregg: "It begins by posing questions, and then seeks answers, instead of beginning with given metrics (partial answers) and trying to work backwards." — www.brendangregg.com/usemethod.html.
Part 8: Tools, Culture, and the Future
- On Drill-Down Analysis: Gregg's Drill-Down Analysis Method: "Start at highest level. Examine next-level details. Pick most interesting breakdown. If problem unsolved, go to 2." — Brendan Gregg: Performance Methodology.
- On the RED Method: Gregg's RED Method: "For every service or microservice, check: Request rate, Errors, Duration." — Brendan Gregg: Performance Methodology.
- On the CPU Profile Method: Gregg's CPU Profile Method: "Generate a CPU profile (ideally a CPU flame graph). Understand all software in profile > 1%." — Brendan Gregg: Performance Methodology.
- On Researching Tools: Gregg's RTFM Method lists how to research performance tools and metrics: "Man pages, Books, Web search, Co-workers, Prior talk slides/video, Support services, Source code, Experimentation, Social Media." — Brendan Gregg: Performance Methodology.
- On the Time Division Method: Gregg's Time Division Method: "Measure operation time (or latency). Divide time into logical synchronous components. Continue division until latency origin is identified. Quantify: estimate speedup if problem fixed." — Brendan Gregg: Performance Methodology.
- On the RED Method: Brendan Gregg: "For every service or microservice, check: Request rate Errors Duration" — www.brendangregg.com/methodology.html.
- On Doing It at Scale: Brendan Gregg: "Do anything, do it at scale, and do it today." — www.brendangregg.com/blog/2026-02-07/why-i-joined-openai.html.
- On Automating 15 Percent: Brendan Gregg: "These would only automate about 15% of what I do as a performance engineer" — www.brendangregg.com/blog/2025-11-28/ai-virtual-brendans.html.